
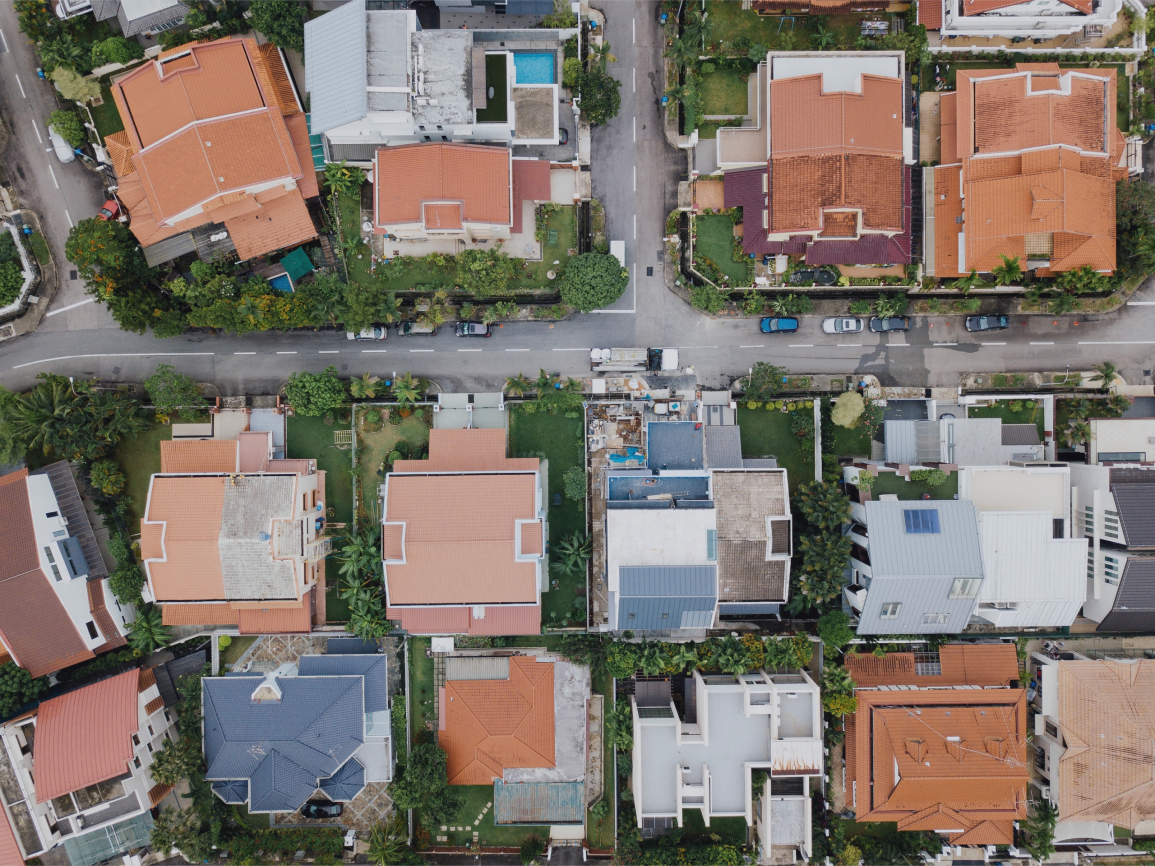
Toronto Real Estate Statistics Highlights
Affordable housing in Toronto is an extreme problem, the City of Toronto has been recognized as being one of the most unaffordable cities in the world.
Demographia.com in 2019 released their 15th annual report on International Housing Affordability, “15th Annual Demographia International Housing Affordability Survey: 2019”. They ranked 293 global cities in Australia, Canada, China (Hong Kong), Ireland, New Zealand, Singapore, the United Kingdom, and the United States. Toronto in their 2019 affordable housing survey, is currently ranked as the 10th most unaffordable city in the world.
Toronto’s affordable housing crisis. Affordable housing is a problem that many growing urban centres around the globe are facing, it is not only a problem in Toronto, Canada, etc. as much of the population in the coming generations will be moving into cities and urban areas. Toronto in 2018 was previously ranked 21st for unaffordability in this same survey.
Only one in five families can now afford to live in Toronto because rent and home prices have skyrocketed so much that maybe 20% of people have the income to live in Toronto and afford it, i.e. spending less than 30% of their monthly income on housing. While affordability is up 0.3% this is still not enough.
Highlights from the City of Toronto’s MLS for 2019 statistics:
- Based on the City of Toronto’s current MLS statistics for August 2019, the average price for a home in the City of Toronto is $833,022 CAD.
- Current statistics for Toronto’s MLS® during August 2019, until 12 August 2019, demonstrate that the houses are on the market for a median of 22 days.
- According to the Toronto Real Estate Board (TREB) during June 2019 the average sale price for homes in Toronto was $832,703, which is three percent higher than the average price for homes in the City of Toronto during June 2018. The average price for homes in Toronto during June was $808,066. (The Canadian Real Estate Association (CREA) 2019)
- The Toronto Real Estate Board (TREB) reports that during the first half of 2019 (January-June 2019) the average selling price for a home in Toronto was $810,661, which is a 2.4 percent increase in the average sale price for homes during the first half of 2018 (January-June 2018)
The Toronto Real Estate Board at the end of June 2019 reported that Greater Toronto Area REALTORS® reported 8,860 sales through TREB’s MLS® System on June 2019, this is a 10.4 percent increase in sales compared to sales during June 2018. During June 2018, the total number of new listings stayed at a similar level for the month of June 2019. Active listings in the Toronto Real Estate Board’s MLS® system were down by 5.7 percent.
Sales during the first half of 2019 (January-June 2019) were up by 8.5 percent. However, new listings during the first half of 2019 increased by less than one percent. This means that during the first half of 2019, sales accounted for a greater number of listings than during the first half of 2018. This meant that competition between buyers increased, which resulted in higher prices for different parts of the market, especially for Semi-detached houses. Condos, and Townhouses.
Highlights from The Toronto Real Estate Board’s (TREB) July 2019 Market Watch Report, re: sales during 2019, specifically year-to-year June 2018 to June 2019 and July 2018 to July 2019
- During July 2018, the average home price was $781,918 CAD, during July 2019, the average home price during July 2019, was $806,755, this was a 3.2% increase in the average home price in Toronto from year to year.
- Residential home sales from July 2019 versus July 2018 in the City of Toronto were 24.3% higher during July 2019, when compared to home sales in Toronto during the same time in July 2018.
- The Toronto Real Estate Board (TREB) reported that Toronto’s real estate market during the first half of 2019 (January-June 2019) has tightened considerably, meaning there are fewer homes for sales and more people looking to buy, making this a seller’s market at the moment. Active listings in Toronto during July 2019, were down 9.1% when compared year-over-year.
- During 2019, there has been more competition between buyers for semi-detached houses, townhouses, and condo apartments.
- The average prices for detached houses in the 416 fell 9.1 percent year-over-year (between July 2018 and July 2019) and prices for detached homes in the 905 only increased 2.5% year-over-year, from July 2018 and July 2019. In total, the average price for a detached home in Toronto fell 0.9% year-over-year.
- However, the prices for semi-detached houses, condos, and townhouses increased year-over-year from July 2018 to July 2019 in Toronto.
- The average price for a Semi-Detached home in Toronto has increased on average by 5.3% year-to-year from July 2018 to July 2019
- The average price for a Townhouse in Toronto has increased by 4.3% year-to-year from July 2018 to July 2019.
- The average price for a Condo Apartment in Toronto has increased by 6.7% year-to-year from July 2018 to July 2019.
- Generally, the increased competition between buyers for available properties in Toronto has resulted in a relatively strong price growth, which is greater than the rate of inflation, this is especially true for semi-detached houses, townhouses, and condos. However, the market for single-detached houses in Toronto that was most impacted by the new B-20 programme regulations that included a mortgage stress test was implemented on 1 February 2018, by the Office of the Superintendent of Financial Institutions (OSFI). The market for single-family detached houses has been most affected by these changes in mortgage regulations and is not seeing the growth in prices that semi-detached houses, condos, and townhouses are experiencing. As a result, the average price for detached homes in some parts of Toronto during July 2019 lower than they were during July 2018.
- The Toronto Real Estate Board (TREB) reported that total real estate transactions year-over-year from July 2018 to July 2019, increased 24.3%, with 6,916 residential real estate transactions for July 2018 and 8,595 residential real estate transactions reported for July 2019. (Toronto Real Estate Board “Stats Infographic | Market Watch: Quick Overview)
- The seasonally adjusted average sale price between June 2019 and July 2019, increased from $811,947 as of the average selling price in June 2019, to $829,164 as of the average selling price for homes in Toronto during July 2019.
Statistics and Information on Condos and Condo ownership in Toronto and the Greater Toronto Area (GTA)
- More than a third of condos in Toronto are owned by investors, this means that 37.9 percent of condos in Toronto are owned by investors and are not owner-occupied. This means that nearly 40 percent of condo owners do not live in their condos, instead, nearly 40 percent of condo owners rent out their condos, use them as a second home or leave them vacant
- 10% of all new condos in Toronto built during 2016 and 2017 are owned by non-Canadian residents and nearly 9% of all condos built in Toronto between 2006 and 2017 have at least one non-resident owner on the title
- “In 2017, Statistics Canada and the Canada Mortgage and Housing Corporation (CMHC) reported that 3.4 percent of all residential properties in Toronto were owned by non-residents.”)
- While a new report from the Canadian Housing Statistics Project (CHSP) shows that during 2018, at least 66,240 properties in Canada worth roughly $44-billion CAD involves at least one non-resident owner.
Who owns property in Toronto and Ontario, immigration and property ownership statistics from the Canadian Housing Statistics Program (2018)
- A Statistics Canada report published on 11 July 2019 notes that account immigrants own 43.1% of residential properties in Toronto. Immigrants own 37.2% of residential properties in Vancouver.
- During 2018, in Ontario, 23.3% of individual residential property owners were immigrants, in British Columbia, 23.1% of property owners in British Columbia are immigrants and 3.8% of property owners are immigrants in Nova Scotia
- .For this data set which goes through 2018, recent immigrants, are people who arrived between 2009 and 2016 made up a small share of immigrant property owners in Ontario, while immigrants who arrived between 1980 and 2008 account for the majority of immigrant property owners in Ontario, they are 85.4% of property owners in Ontario. Immigrants who arrived sometime between 1980 and 2008 account for the majority of immigrant property owners in British Columbia (83.3%) and Nova Scotia (72.9%) in 2018.
- In Ontario, the majority of immigrant-owned properties owned had higher median total assessment values for tax purposes than properties owned by non-immigrants. In many cases, more recent immigrants (people who arrived between 2008 and 2016) owned lower-value properties than immigrants who had arrived earlier in Canada. However, there are exceptions for recent immigrants who owned multiple properties in Ontario, British Columbia, and recent immigrants who owned one property in Nova Scotia.
- In Ontario, British Columbia, and Nova Scotia, the three provinces with the highest rates of immigrant property owners, the majority of immigrant property owners were more likely to have been admitted to Canada through economic entry categories than other entry categories. While immigrants admitted to Canada through Canada’s Federal Skilled Worker program accounted for more than one-third of all immigrant owners.
- 11.5% of immigrant property owners in Ontario had more than two properties and 3.8% of immigrant property owners owned three or more properties in Ontario
- The top three countries for immigrant property owners in Ontario in 2018 were: India, China, and the Philippines.
Statistics on housing availability for July 2019 from The Toronto Real Estate Board (TREB) and tightening of the housing market in Toronto
The Toronto Real Estate Board (TREB) reported that Greater Toronto Area REALTORS® reported 8,595 sales through their MLS® System during July 2019. This number of sales through TREB’s MLS® System had increased by 24.3 percent when compared to July 2018. When comparing sales month-over-month in June 2019 and July 2019, after a preliminary seasonal adjustment, sales had increased 5.1 percent.
Toronto’s Real Estate Board (TREB) notes that the number of new listings entered into their MLS® System by during July 2019 had increased when compared to the number of listings entered into their MLS® System during July 2018. But this increase in listings in the TREB’s MLS® System is lower than the number of sales reported by Greater Toronto Area REALTORS®. The number of listings only grew by a much lower annual rate at 3.7 percent.
With this increased growth in home sales without a corresponding increase of homes being put onto the market, this means that the Toronto real estate market is becoming tighter as the demand for homes is exceeding the supply of available homes. The Greater Toronto Area REALTORS® report that the number of active listings in the Toronto Real Estate Board’s MLS® System at the end of July 2019 is down 9.1 percent, year-over-year, when compared to the number of active listings in the Toronto Real Estate Board’s MLS® System at the end of July 2018.
With the tightening up in the Toronto real estate market, the average selling price increased by 3.2 percent year-over-year to $806,755. The Toronto Real Estate Board’s MLS® Home Price Index Composite Benchmark was up by 4.4 percent. The Toronto Real Estate Board reports that the sales of higher density homes, in other words, the increase in the average sale price for condos, townhouses, and semi-detached houses in the area is what is responsible for driving up this price growth. The sales of single-family detached houses are not responsible for this increase in prices in Toronto.
Information and statistics about the future of affordable housing in Toronto, and Millennials rehousing in the Greater Toronto Area (GTA) and Hamilton, what does the future look like? What needs to happen so Millennials and members of Gen Z (approximately 1996/2000/2001-2011) will be able to afford to live in and stay in Toronto and the Greater Toronto Area (GTA)?
There are approximately 700,000 Millennials in the Greater Toronto Area (GTA) and Hamilton who might be looking to move out of their parents’ homes and establish their own households within the next decade. (Millennials can be defined as either people born during 1980 or 1981-1996, or anyone born between 1981-2001 depending on who you ask, in this report Millennials they are defining millennials as anyone that was born between 1 January 1981-31 December 2001. There is no real consensus for the beginning and end of who is a millennial)
According to “Millennials in the Greater Toronto and Hamilton Area: A Generation Stuck in Apartments?” a report sponsored by the Ontario Real Estate Association (OREA), published during May 2018 by Ryerson University’s Centre for Urban Research & Land Development (CUR) “Millennials will represent the largest source of housing demand in the next ten years. However, if the current home building trends continue, the housing market will be short roughly 70,000 ground-related housing units required to meet Millennial demand.”
According to this report, Baby Boomers are not expected to downsize, freeing up resale housing (i.e. selling their homes to move into smaller homes) until the mid-2040s. Given this, the housing market in the Greater Toronto Area (GTA) and Hamilton will need to meet the demands of Millennials, in other new homes need to be built to meet the demand of Millennials looking to buy homes in the Greater Toronto Area (GTA) and Hamilton. The authors of this report that millennials will probably cause the next baby boom, therefore, policymakers need to ensure that more family-friendly ground-oriented housing is being built.
The fact that homeownership in Toronto is unaffordable and unattainable for so many people does not only affect young people in Ontario and their families, a lack of options for affordable housing might also push young professionals into longer commutes, which would create more traffic for everyone in Ontario. If this affordable housing crisis in the City of Toronto and shortage of affordable housing in the Greater Toronto Area (GTA) continues, many talented, smart, innovative, accomplished, and well-educated Millennials are likely to leave the Greater Toronto Area (GTA) and Hamilton or the province of Ontario altogether.
“A shortage of housing puts pressure on Millennials, their parents and roadways, as buyers move further away from city centres in search of affordable homeownership. These highly educated and talented young people want a home for their kids to grow up in.” -Tim Hudak, Chief Executive Officer, Ontario Real Estate Association (OREA)
“Homeownership rates among Millennials are no different than past generations, suggesting they are likely to continue to want to own [homes]. But our research shows that the Baby Boomers are unlikely to free up room in the housing market for Millennials. That means there’s a real risk that housing affordability concerns could push Ontario’s Millennial talent pool–the most educated in Canada–out of the province.” -Frank Clayton, Senior Research Fellow at the Centre for Urban Research & Land Development (CUR), at Ryerson University
Since 2006 Millennials have been the fastest-growing group in the Greater Toronto Area (GTA) and Hamilton. Immigration is one major contributor to this growth in Millennials in the Greater Toronto Area (GTA) and Hamilton given that 32% of Millennials immigrated to the Greater Toronto Area (GTA) and Hamilton at some point during the past 30 years. (Petramala, et al. 2018:6)
Continued, strong immigration from outside of Canada to the Greater Toronto Area (GTA) and Hamilton could attract 200,000 or more Millennials to the area during the next decade. While more recently, the economic downturn in parts of Canada whose economies are more oil-dependent areas pushed more Canadian millennials searching for better economic and job prospects to migrate to the Greater Toronto Area (GTA) and Hamilton during 2016 and 2017. (Petramala, et al. 2018:6)
“New data from the Canadian Housing Statistics Program show that one in seven individual owners of residential property in British Columbia and Ontario is a millennial.”
Sources consulted on 15 August 2019 and some of these I cited for statistics
Canadian Broadcasting Corporation (CBC) News. 2019. “‘Busiest’ Construction Season Ever Underway in Toronto with $1B in Projects in the Works | CBC News.” CBC. Retrieved August 15, 2019
Khoo, Isabelle. 2019. “Only 1 In 5 Families Can Afford A Toronto Home Due To High Prices.” Toronto Storeys. Retrieved August 15, 2019
Lindeman, Tracey. 2019. “Nearly 40% of Toronto Condos Not Owner-Occupied, New Figures Reveal.” The Guardian, July 7, 2019. Retrieved 15 August 2019. Retrieved 15 August 2019
Petramala, Diana, Frank Clayton, Alex Butler, Amanda Mackaay, Alison Quigg, and Eileen Quigg. 2018. Millennials in the Greater Toronto and Hamilton Area: A Generation Stuck in Apartments? Toronto, Canada: Ryerson University, Centre for Urban Research & Land Development. Retrieved 15 August 2019
PricewaterhouseCoopers (PwC) Canada: “Emerging Trends in Real Estate 2019” (n.d.) Retrieved 15 August 2019
Smetanin, Paul, David Stiff, Evelyn Barake, Jeff Evenson, Daniel Liadsky, Keir Matthews-Hunter, Alexandra McDonough, and Mercedeh Madani. 2019. Toronto Housing Market Analysis: From Insight to Action. Toronto, Canada: The Canadian Urban Institute (CUI) and Canadian Centre for Economic Analysis (CANCEA). (Prepared for The Affordable Housing Office (AHO) of the City of Toronto.) Retrieved 15 August 2019
The Canadian Press, Canadian Broadcasting Corporation (CBC) News. 2019. “Toronto Home Sales Up 18.9% in May from Last Year, TREB Report Says | CBC News.” Canadian Broadcasting Corporation (CBC). Retrieved August 15, 2019
The Canadian Real Estate Association (CREA). 2019. “National Statistics: Canadian Home Sales Rise in July.” The Canadian Real Estate Association (CREA). Retrieved August 15, 2019
The Canadian Real Estate Association (CREA). 2019. “Toronto Real Estate Board: TREB Releases June Market Figures as Reported by GTA REALTORS®.” The Canadian Real Estate Association (CREA). Retrieved August 15, 2019
Government of Canada, Statistics Canada. 2019. “The Daily — Canadian Housing Statistics Program, 2018.” Government of Canada, Statistics Canada. Retrieved August 15, 2019
Toronto Real Estate Board (TREB). 2019. “TREBHome – Market Watch July 2019: GTA REALTORS® Release July 2019 Stats.” Toronto Real Estate Board (TREB). Retrieved August 15, 2019
Toronto Real Estate Board (TREB). 2019. “TREBHome – Stats Infographic: Quick Overview: August 2019.” Retrieved August 15, 2019
Toronto Storeys. 2019. “40 Percent Of Toronto Condos Are Investor-Owned, Driving Up Prices.” Toronto Storeys. Retrieved August 15, 2019
Zolo.ca. August 2019. “Toronto Housing Market Report | August 2019 Real Estate Trends & Stats | Zolo.Ca.” Zolo.Ca. Retrieved August 15, 2019

Read More
Connect With Us
Connect with our friendly Client Ambassadors and find the best Agent to match your needs
Call us at 1-647-794-0064
Join Our Team |Become a Partner